Wealth Management - Design Solutions
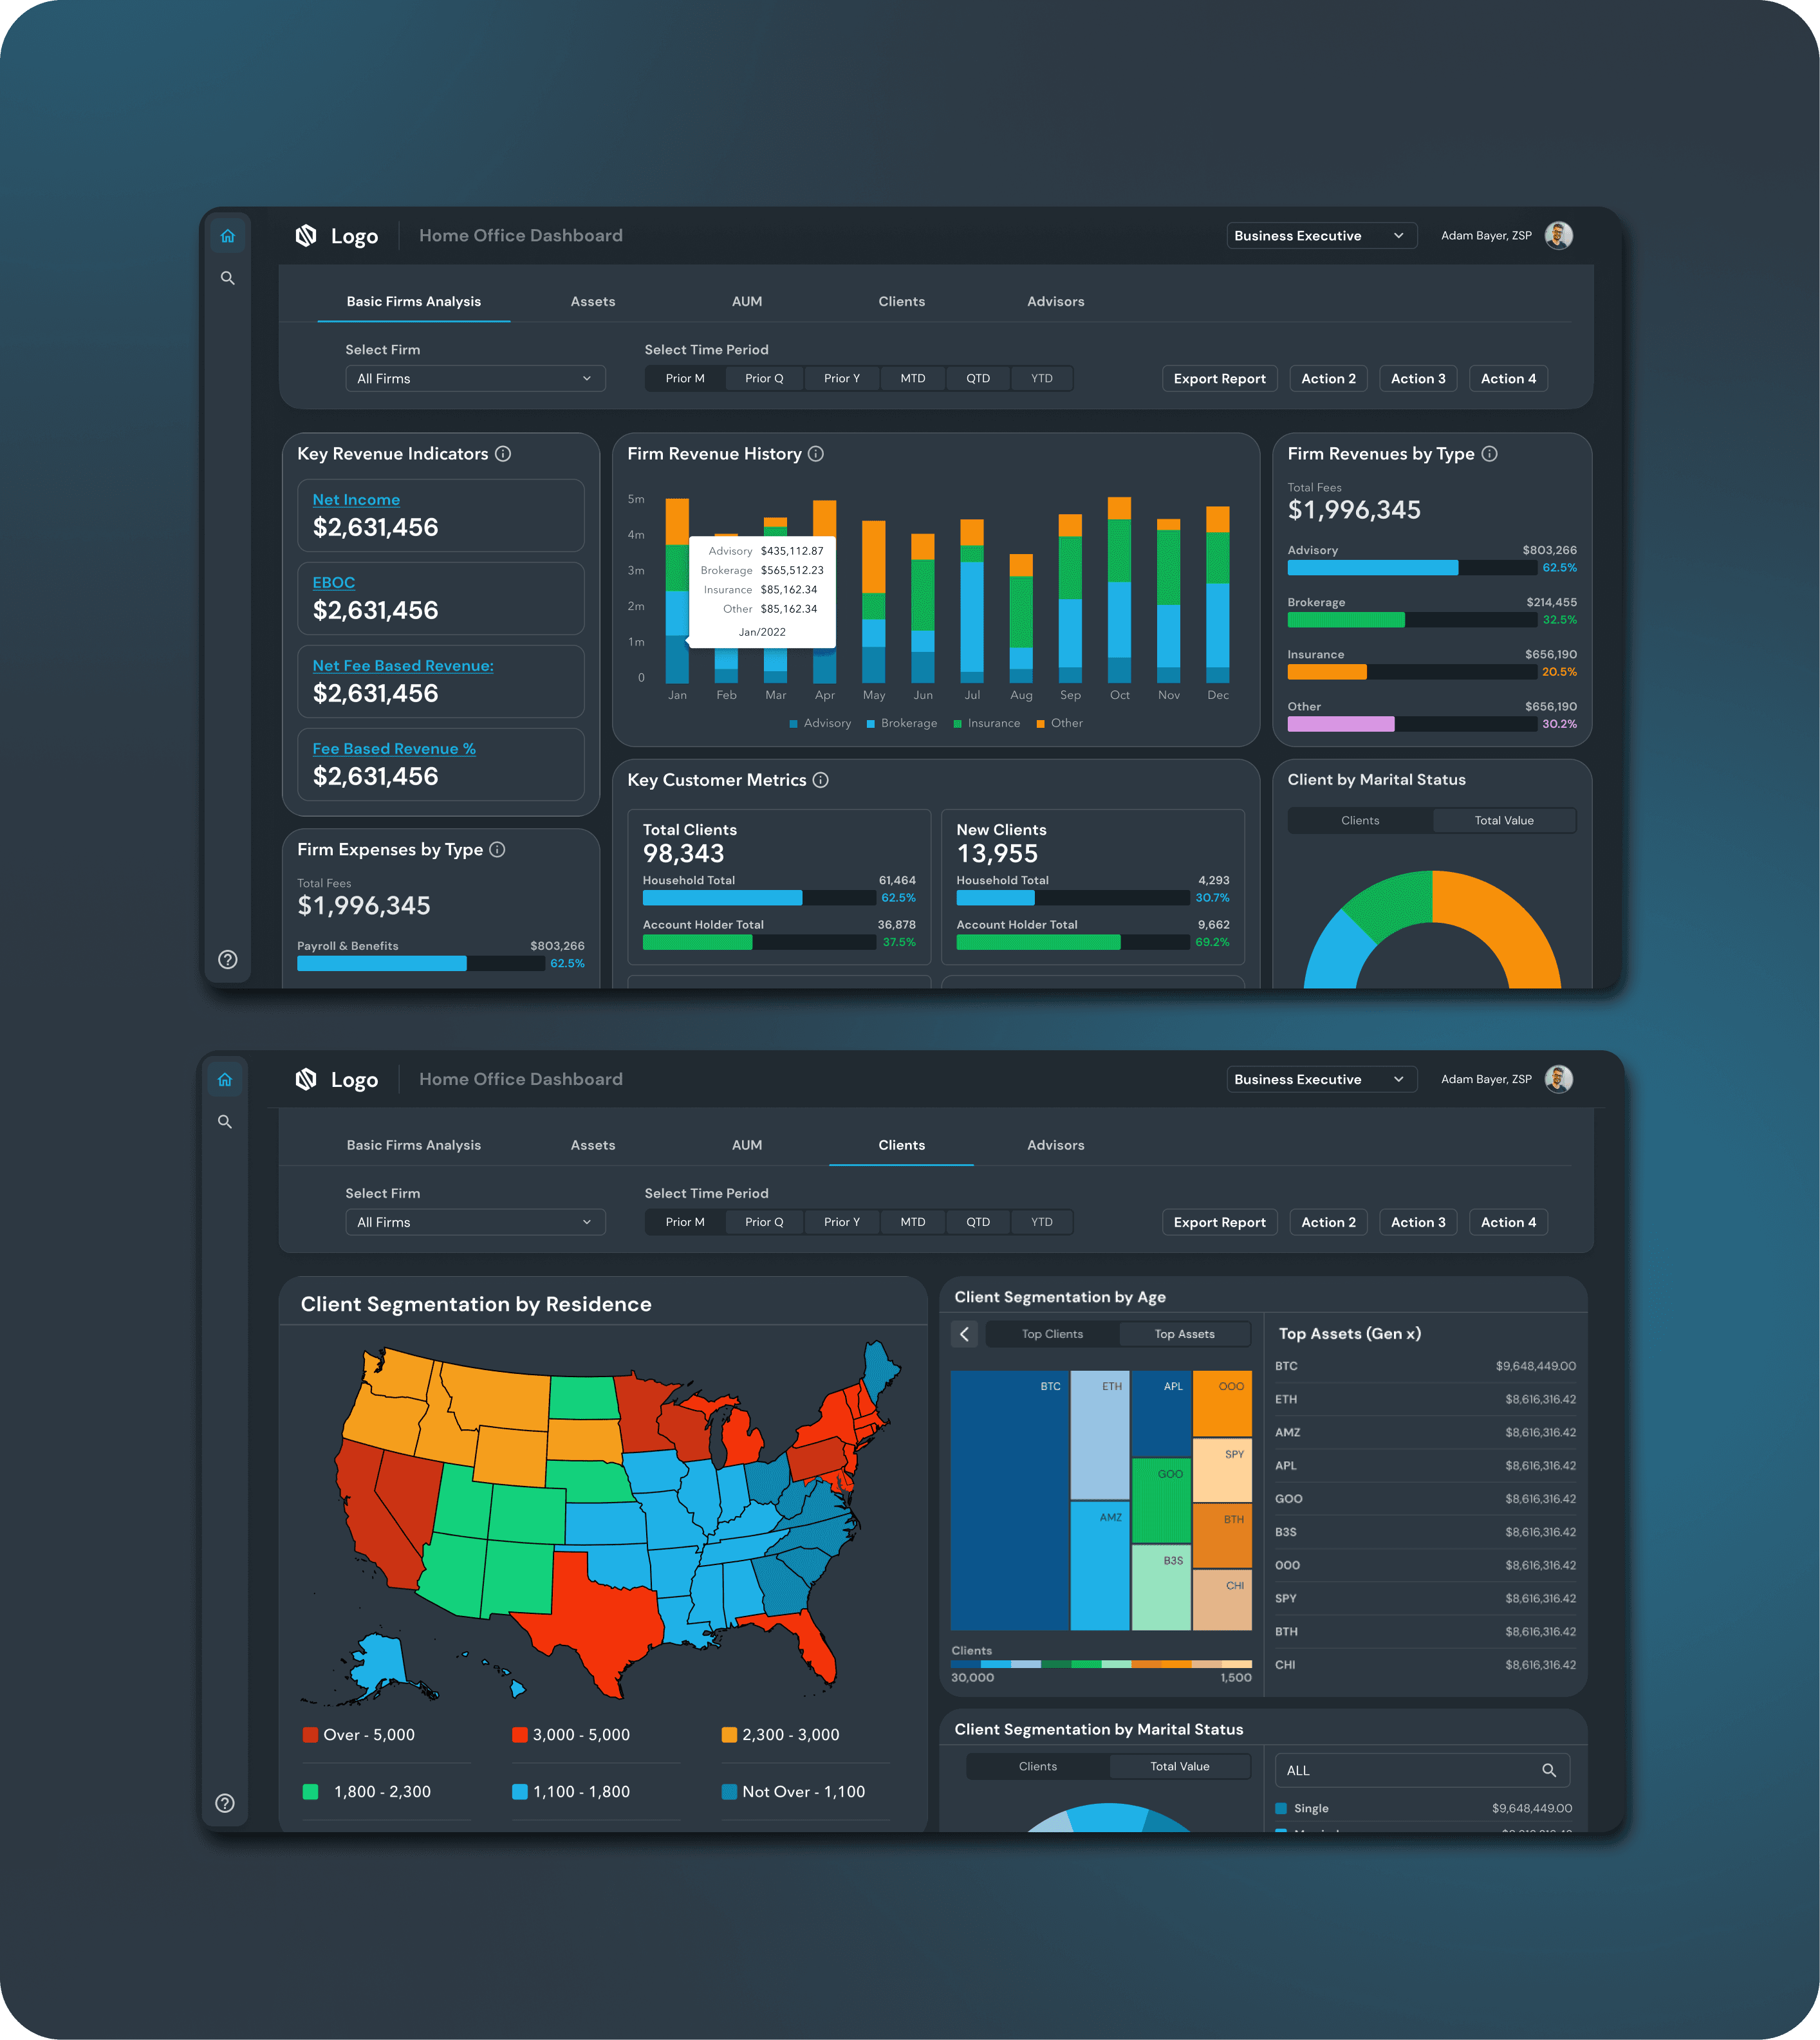
This project aims to develop a new set of widgets to visualize the client's data in an innovative way. Additionally, it seeks to design a fully customizable dashboard solution.
Objective
The Client needed business intelligence insights for their partner firms. These types of datapoints typically center around assets, clients, advisors, custodians, and model providers/asset managers. The intent of these metrics is to highlight concentration risks such as a firm weighted heavily to a single client or one advisor managing most of the firm’s book, better understand partner firm profiles to benchmark them against each other to help under performers understand what makes top performers successful, and identify collective bargaining opportunities with model providers/fund companies, and asset managers. This will likely be an iterative process as we get a better understanding of what data elements are available and what insights we can help the Client extract. The following KPIs are what have currently been proposed and an assessment of what is currently feasible.
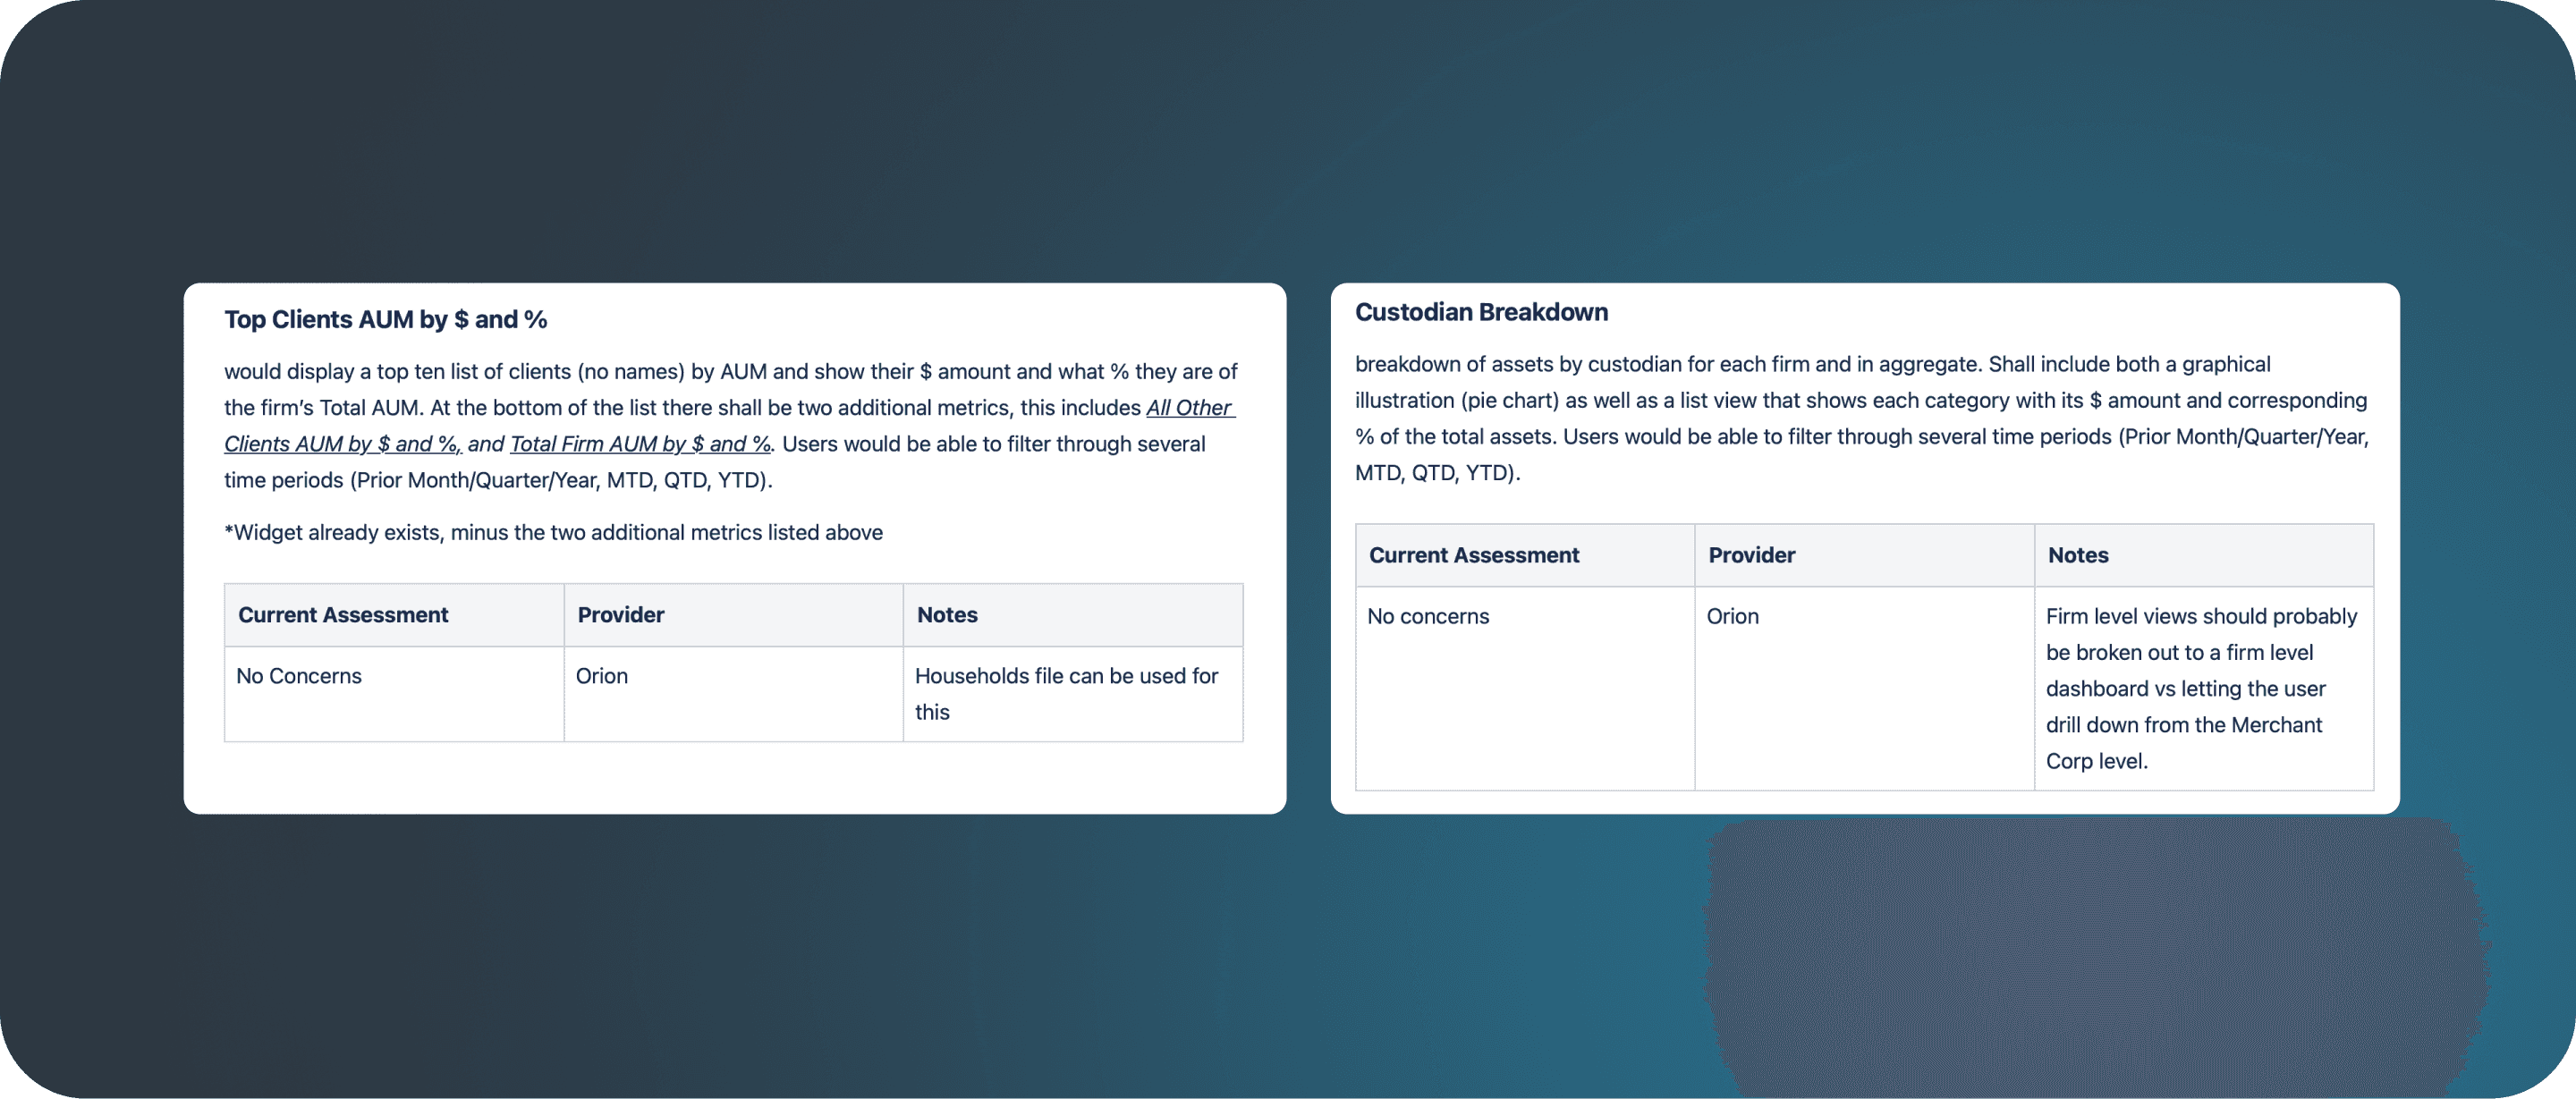
KPI Discovery
After making the high level goals clear, there was a need to analyze what KPIs the clients needed and which data was possible for us to get.
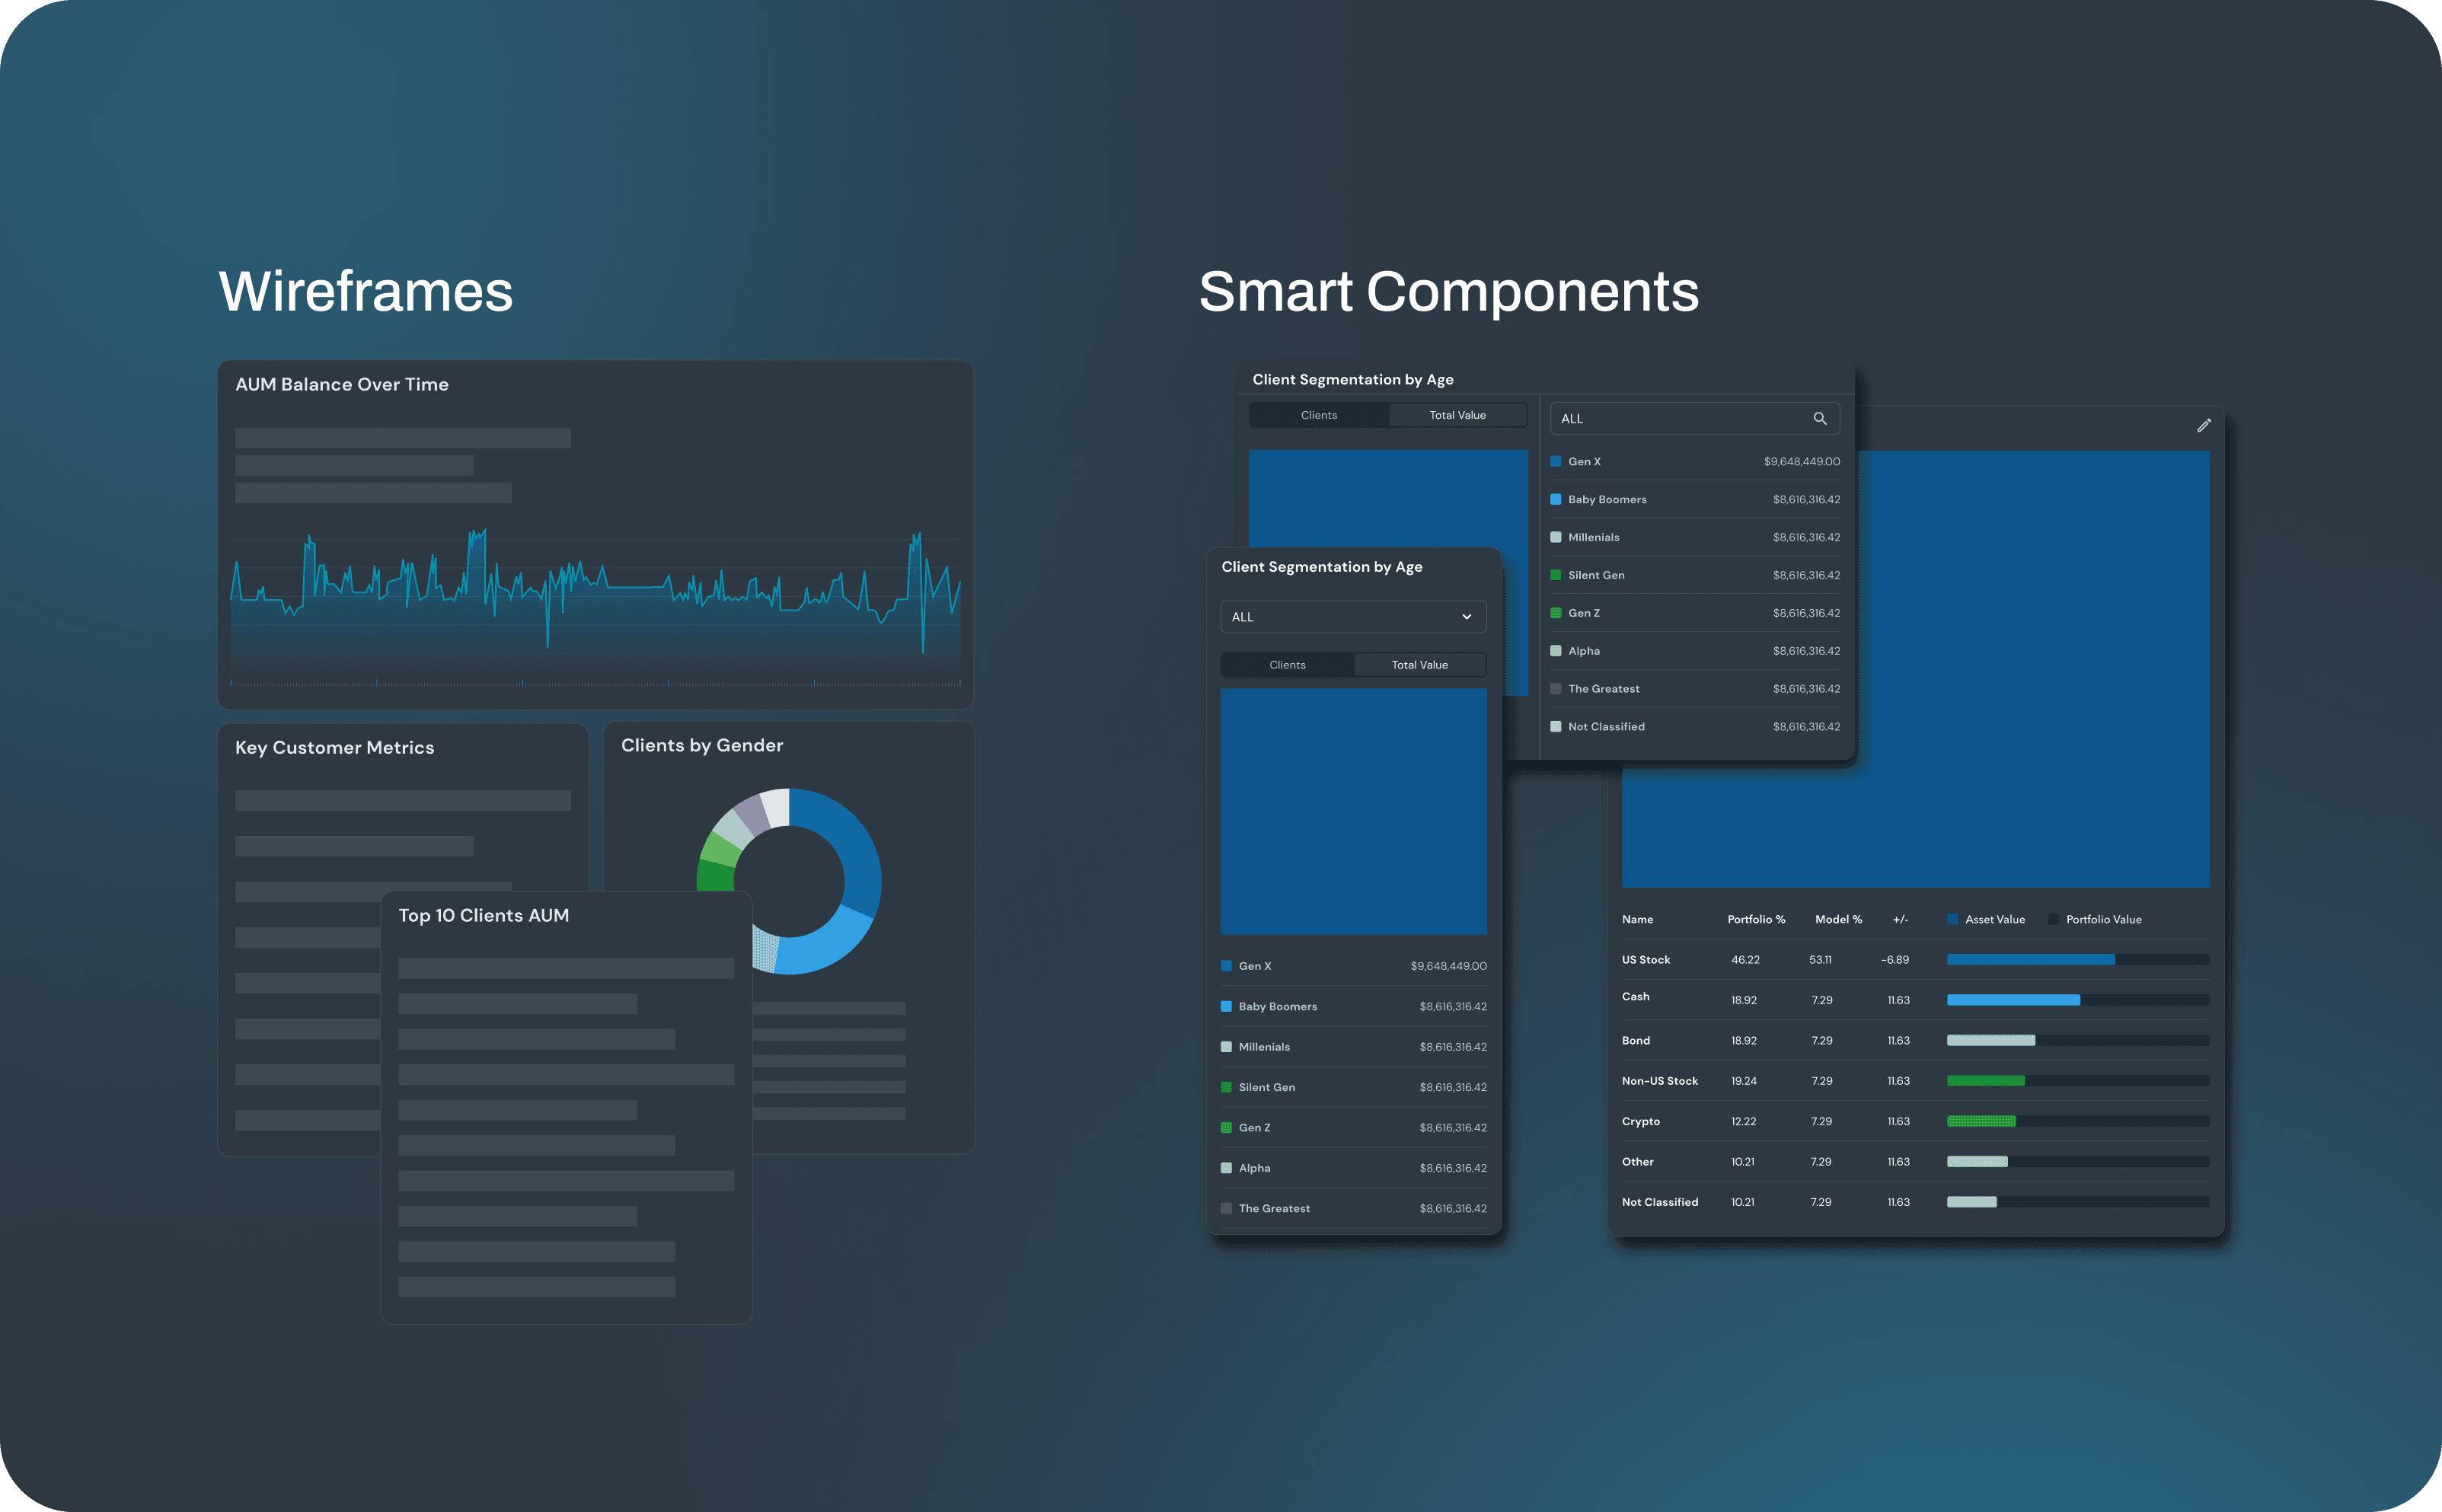
Widgets Proposition
With the correct KPIs in mind, wireframes were created to help visualize different ways of how the data could be represented within the widgets. After those were validated, we moved into high-fidelity prototypes. After that following Data Visualization best practices, smart components were created to accommodate different user scenarios and amounts of data.
Custom Dashboard Experience
The Dashboard was created with a widget-focused experience, allowing each user to customize which widgets they want to see, as well as their size and order.